Formatting Properties of Line/ Area Chart
* Formatting Settings Menu:-
- The Formatting properties are used to control and apply all the information appearance in Line chart through the categories of General, Series, Legend properties.
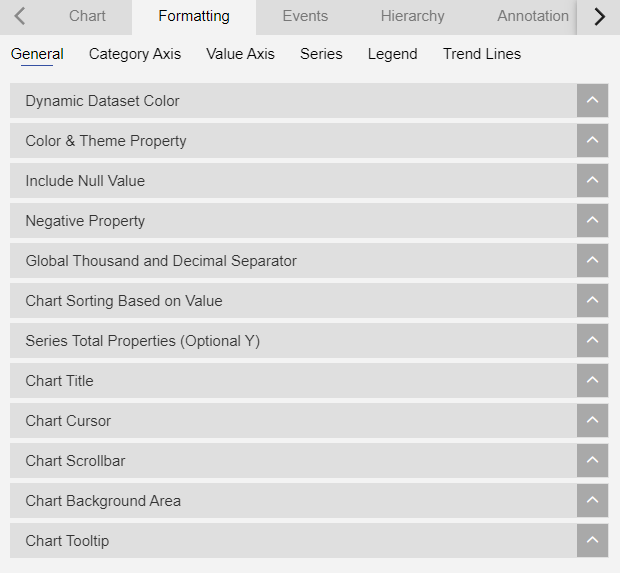
* General Properties:-
The General settings used to add Color and Theme changes as user required, Chart title, Chart information tooltip, Export settings are used to control by the general.
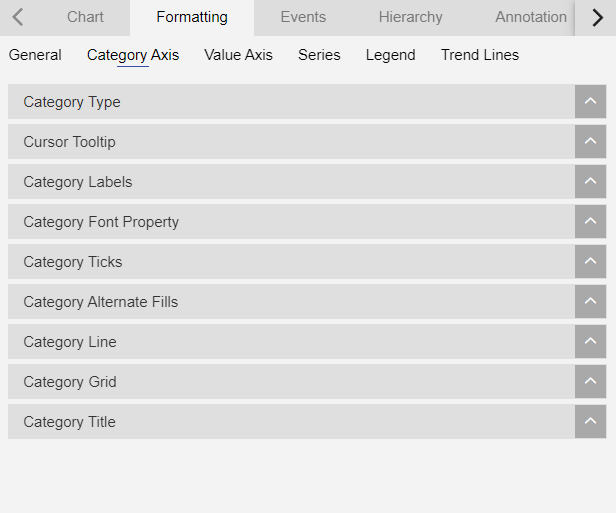
* Category Axis:-
Category Axis
The Category Axis Property used to modify the Category Axis of Chart by changing Category Axis Line, Category Axis Ticks, Category Axis Label, Category Axis Grid, Category Alternate FIlls and etc..
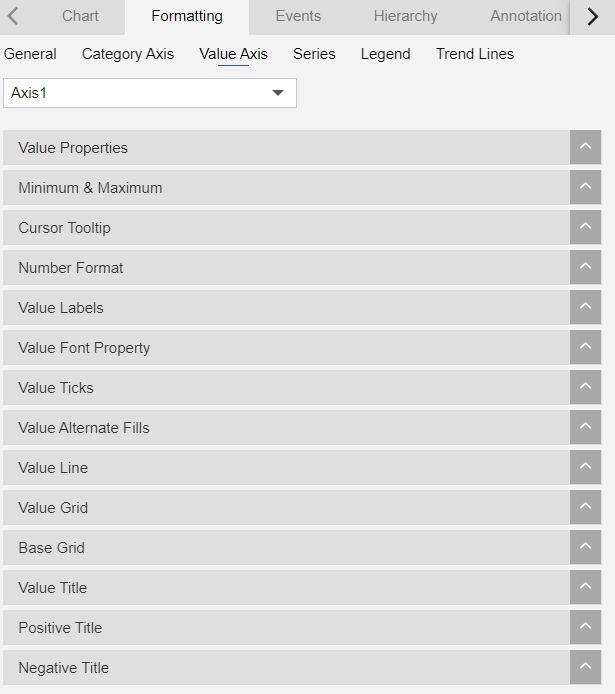
* Value Axis:-
Value Axis
The Value Axis Property used to modify Value Axis of Chart using Number Format, Negative Title Cursor Tooltip, Value Axis Grid, Value Axis Label, Value Axis Font Property and etc..
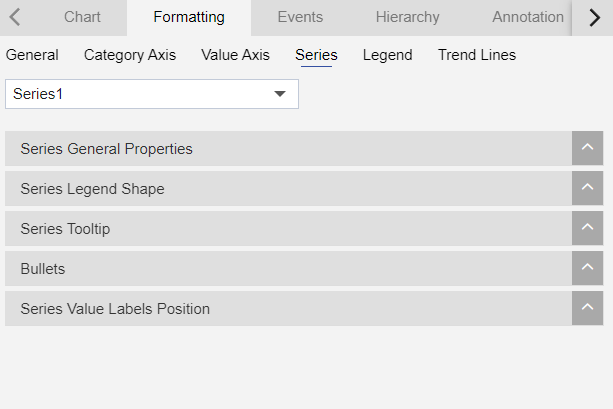
* Series Properties:-
- Series Properties are used to apply the pie chart series settings like slice appearance, tick’s appearance, labels, grouping of series, customized tooltips, dynamic labels.
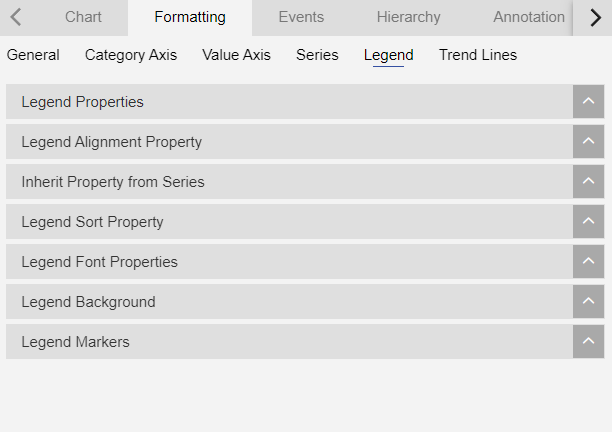
* Legend Properties:-
Legends’s properties are used to add legends to the pie chart and apply user required appearance settings to legends.
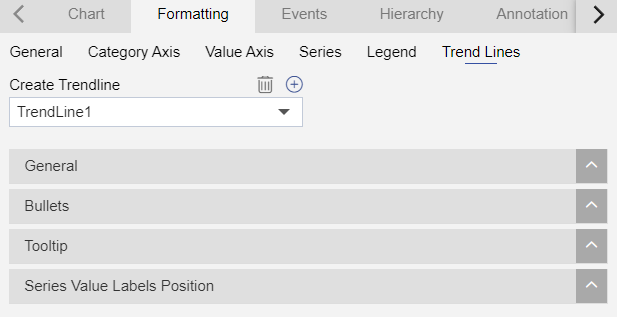
* Trend Line:-
Trend Line
To know more about other formatting properties click on below links:-
1. General Properties
2. Category Axis Properties
3. Value Axis Properties
4. Series Properties
5. Legend Properties
6. Trend Line
In order to understand in detail about Line/Area Chart, click on the following links:-